Investing during a recession (Part 1/3)
Investing in the stock market during a recession is scary. But a strategy of selling stocks after nerve-racking world events simply doesn't work.
The most common financial question I've been asked during this current crisis has been:
Should I pull my money out of the stock market? Should I hold off on buying more stocks? It seems smart to avoid stocks given all of the recent uncertainty.
After a decade of stable stock growth, the pandemic has made the risk of investing in stocks feel much closer to home. We see friends, family, or neighbors getting sick. We watch the news and see the stock market swinging wildly up and down. And to be sure, shielding our money from a turbulent stock market can make us feel safer.
But selling stocks as a reaction to world events is a bad strategy
In a series of three posts, I'll explain why selling stocks in this situation, counterintuitively, makes you more likely to lose money than to safeguard it:
The Three Posts
Follow me on Twitter or sign up for the email newsletter to be notified about future posts.
Don't time a growing market
There is no question that investing in stocks involves risk. This has been shown by the many stock market crashes throughout history. During the start of the COVID-19 crisis, the stock market lost 34% of its value from its peak to its trough.1 That was scary enough, but at the start of the Great Depression, the stock market lost 87% of its value.2
Despite this risk, virtually all economists and finance professionals still recommend we invest in stocks. Why?
Because over the long term, the stock market has consistently provided high returns.
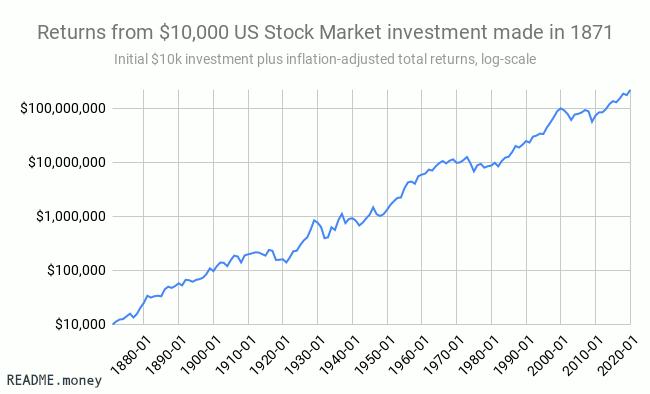
This graph shows the incredible returns of the US stock market between 1870 and 2020.3 The graph has a log scale, meaning that American businesses have grown exponentially over time. If a family (multi-generational or a vampire) invested $10,000 in the overall stock market in 1871, it grew to $1.3 million by 1950 and $101 million by 2000. This is roughly a 6.7% return per year after adjusting for inflation.
These 150 years included pandemics, major cultural upheavals, wars (including the world wars), terrorist attacks and many other frightening periods when the world seemed poised to change permanently.
Despite all this, the markets grew relentlessly. There was no 20-year period over which US stocks lost money.
There is also no guarantee that the future will repeat the past. But since the market has such a consistent history of going up, an investor should have strong reasons or evidence before betting that it will go down. They should certainly have more than a gut feeling or a recommendation from a TV commentator.
Wharton finance professor and stock market historian Jeremy J. Siegel explains it like this:4
In the short run...stock returns are very volatile...Yet these short-term swings in the market, which so preoccupy investors and the financial press, are insignificant compared with the broad upward movement in stock returns.
Smart investors make investment decisions based on their needs and their long-term expectations. Not based on current events.
But what if you want to stay out of the market while it's volatile?
Even when you understand that the market has gone up over time, it's still painful to watch it go down while you're invested. You might reasonably ask: "Can I stay out of the market for now, while it's risky, and get back in later?"
Deciding how much risk you are willing and able to take is very important,5 but the question needs to be asked before the market becomes volatile, not afterwards. As the common saying goes, you want to "buy low and sell high," and not the reverse. The data confirms this.
Personal investors constantly trade in and out of the market based on their own emotions and intuitions, and lose money in the process. According to the research firm Dalbar, the average mutual fund stock investor underperformed the overall stock market by 5.88% annually (before inflation) over the 30 years ending in Dec 2018.6 This would reduce an investor's account balance by 80% after three decades of compounded underperformance.
But what about an investor who was "just" trying to take the risk off the table temporarily? For example, what would happen if a risk-averse investor chose to sell all their stocks whenever the stock market dropped 10% from its peak, and then buy back in 6 months later?
This strategy is similar to what many of my friends and colleagues have suggested by "staying out of the market" for a few months until things "calm down." Unfortunately, it doesn't work.
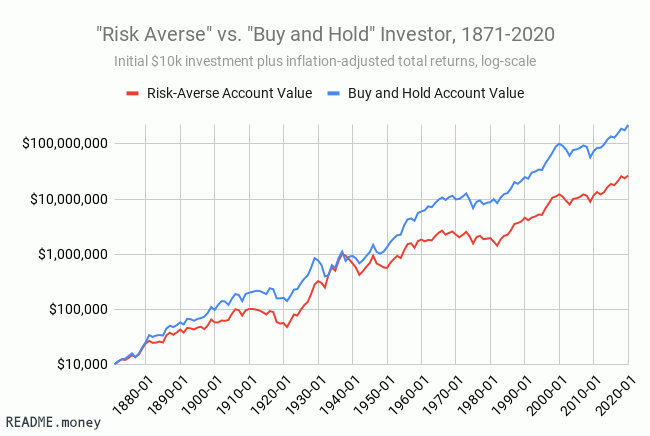
This graph7 is the same as the previous one, except with a new (red) line that shows the returns of the "Risk-Averse" investor who sells all stocks after the market has dropped by 10% and buys back in 6 months later.
The "Buy and Hold" account balance ends 7.3 times higher than the "Risk-Averse" account balance (the lines only look close due to the log-scale). This is the result of the "Buy and Hold" strategy returning 26% higher each year compared to the "Risk-Averse" strategy (on average). Only the time period around The Great Depression (roughly 1929-1939) seems to have significantly benefited from the "Risk-Averse" strategy, at the expense of under-performance in the other periods.
In other words, being an amateur market-timer is a waste of time and money. The stock market has historically gone up over long periods, so inventing your own "hold out" strategy after a drop in the market is likely to add insult to injury.
Key Takeaways
-
The stock market has grown consistently (and exponentially) despite going through many dramatic and frightening periods such as world wars and epidemics.
-
Using a risk-averse strategy to time the market, counterintuitively, makes investors even more likely to lose money than simply holding stocks.
-
Investors should not buy or sell stock based on emotion, intuition, or the recommendations of talking heads, even during periods of high volatility.
The next parts of this series give the intuition behind why "fleeing to safety" doesn't work in the stock market, and what would have happened if you did in previous pandemics.
Follow me on Twitter or sign up for the email newsletter to be notified about future posts.
Appendix: But what if a "risk-averse" strategy exists that does work?
Many technical-minded folks will take the post as an invitation to crunch the data and find a solution to the "Buy and Hold" problem. What if getting out of the market for 12 months after a 15% drop works better?
Academic research suggests that certain variations of this type of strategy, which is called Momentum Investing, have actually worked. The question of whether it will continue to work, and why, is hotly debated.
Regardless, it's important that individual and non-professional investors like you and I should not implement hotly debated strategies based on gut feelings. To give you an idea of how well a "naive" momentum strategy that a personal investor could come up with might work, I crunched some data.
I tested the historical performance of the "Risk-Averse" strategy discussed above against the "Buy and Hold" strategy for all 30-year periods between 1871 and 2020.
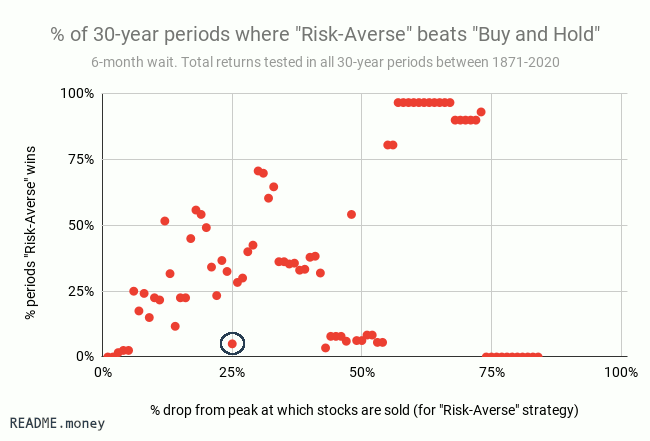
Each point on the graph above shows the proportion of historical 30-year periods when the "Risk-Averse (wait six months after drop)" strategy beat "Buy and Hold."8 So, for example, the circled point tells us that if the Risk-Averse investor sold all their stocks whenever the market dropped by 25%, and bought back in 6 months later, they would have outperformed the "Buy and Hold" investor in only 5% of 30-year periods.
The majority of points (around 7 out of 10) are below the 50% mark on the y-axis, indicating the "Risk-Averse" strategies underperformed. The single period in history when the strategy did seem to work was during The Great Depression (all the points on the right-hand side of the graph).9
Besides the Great Depression, it's difficult to discern any pattern at all in the points over the 50% mark, suggesting that this strategy usually underperforms and that it's not easy to predict when it will outperform.
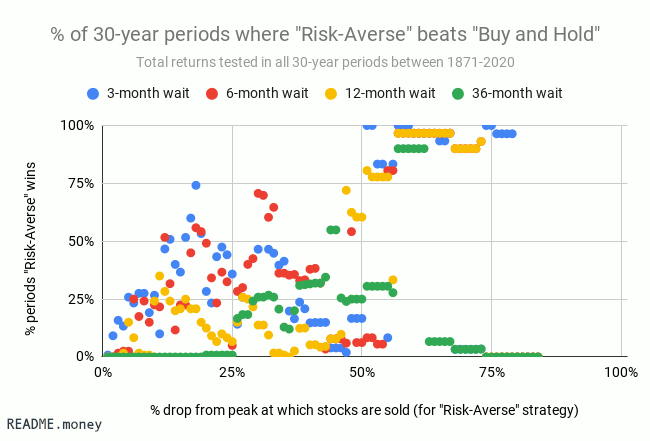
The graph above10 adds three additional waiting periods to the previous one (waiting 3, 12, and 36 months before getting back into the stock market). These additional strategies did not perform any better. "Buy and Hold" beats each of them for the vast majority of points.